Teaching Innovation project
This project is part of an  teaching innovation project from the Faculty of Mathematics and Computer Science, which aims to create an intelligent support system that  tutors and director of studies can use in order to take better decisions in their tasks of supervision and support to students and teachers

UB

Students


The number of students per profile in the 1st year of Computer Engineering. The distribution of each student profile can be seen here.

For this graph we used the grades of 261 students.


The number of students per profile in the 2nd year of Computer Engineering. The distribution of each student profile can be seen here.

For this graph we used the grades of 129 students.


Dropout rate per student profile in the 1st year of Computer Engineering.


Dropout rate per student profile in the 1st year of Math.


Regression line where we can observe that students have lower grades in the first universitary course according to the university acces grades.

For this graph we used the grades of 346 students.

Subjects


Evolution of the average grades for the subjects of the first course of Computer Engineering degree.

For this graph we used the grades of 386 students.


Boxplot with the grades of Integrated Software Project subject where we can observe that students with pre-validated programing subjects have lower grades.

For this graph we used the grades of 196 students.


Interactive graph with the relations between subjects


Using the above interactive graph we can study the relations that may have between the subjects of the Computer engineering degree. We will observe if the grades of the students has similar distributions for different subjects or to the contrary, we have outlier subjects with different distributions.

For this graph we used the grades of 47 students.


Description of the relations between the subjects

To select a subject we have to bring the arrow cursor over the name of the desired subject. Once selected, the following new items will appears:

• The relations that are red colored represents the subjects to which there is a link from the selected subject.
• The relations that are green colored represents subjects from which there is a link to the selected subject.
• The subjects with no type of relation are considered outliers subjects. These subjects have a low correlation with the rest of subjects.


Predictive


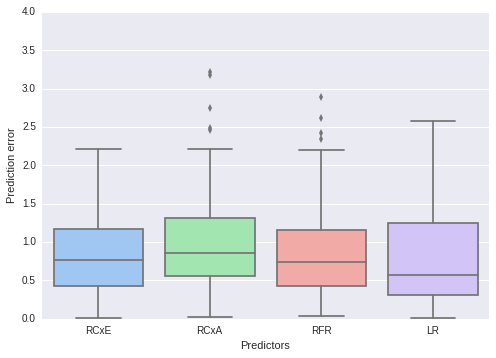
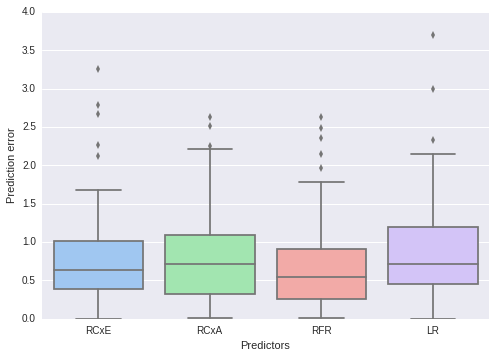
In this plots we can see the accuracy error of each predictor in a box plot. We have used this predictors:

RCxE: Collaborative filtering by students
RCxA: Collaborative filtering by subjects
RFR: Random Forest Regressor
LR: Linear Regressor

The plot on the left:
Training: Marks of first year of Computer engineering
Test: Marks of second year of Computer engineering

The plot on the right:
Training: Marks of first and second year of Computer engineering
Test: Marks of third year of Computer engineering

Team


Daniel Urdas

Ex student

Computer engineering at University of Barcelona

danielurdas

Xavi Moreno

Ex student

Computer engineering at University of Barcelona

xaviml